Buying or Selling in The Woodlands or Magnolia?
Download my free October 2026 Woodlands & Magnolia Market Report to see what homes are really selling for, why contracts just dropped to winter levels, and where buyers have the most negotiating power right now.
This six-page report is built from real HAR MLS data for The Woodlands and Magnolia, explained in plain English.
Download the Free ReportIn October, buyers signed fewer contracts in The Woodlands than in almost any month this year. Pending sales fell to 89, down 28% from a year ago and right in line with January. Meanwhile, Magnolia home values are finally slipping, with price per square foot down 4.2%. Here’s what the latest HAR MLS data means if you’re buying or selling before the holidays.
October 2026 at a Glance
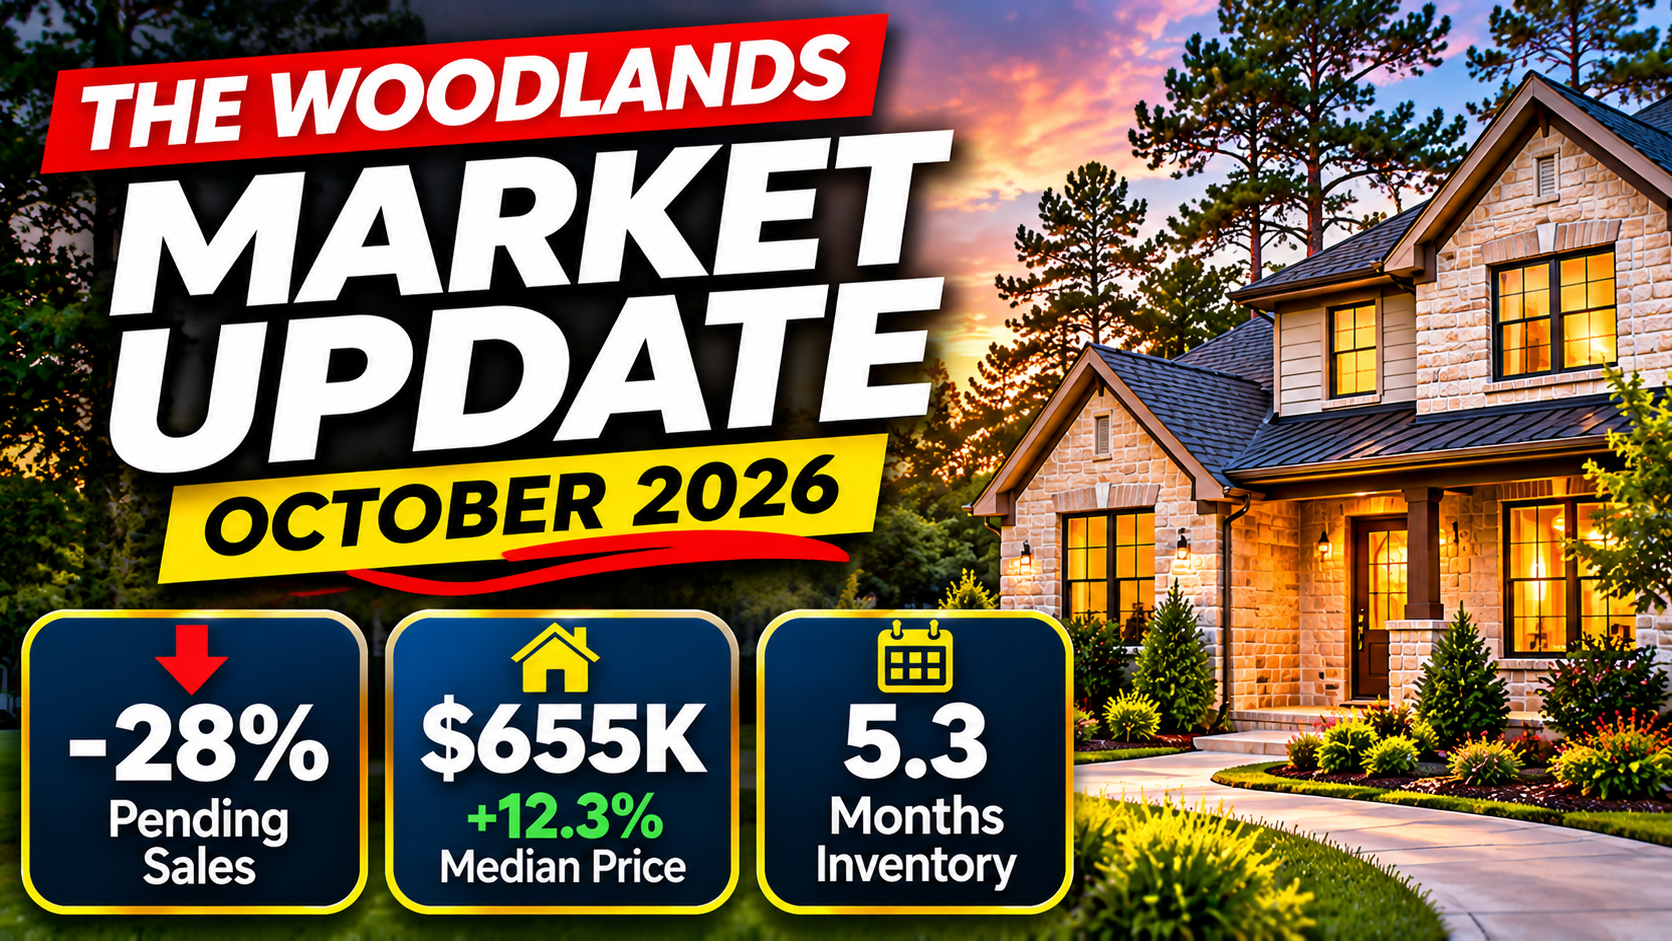
- Woodlands contracts hit winter levels. Pending sales fell 28% year over year, to 89.
- Woodlands values are steady. The median rose 12% because bigger homes sold, but price per square foot is down 2.6%.
- Buyers are negotiating. Only 15.6% of Woodlands homes sold at or above list, down from 26% a year ago.
- Magnolia values are slipping. Price per square foot is down 4.2% year over year, in both new construction and resale.
- Magnolia is a buyer’s market. Inventory is about 8.6 months, and 6 in 10 homes sold after a price cut.
A Quick Correction on September
The MLS keeps updating after each month ends as late closings and status changes are entered. September’s inventory in The Woodlands settled at 4.0 months, not the 5.1 I first reported, and closed sales came in at 114, up from 103. In Magnolia, September inventory settled at 6.5 months, and closed sales rose to 192. The direction is the same: The Woodlands was balanced, and Magnolia was a buyer’s market. Going forward, I’ll flag the newest month as preliminary. October’s sales counts and inventory below may also adjust.
The Woodlands Housing Market: October 2026
| Metric | Oct 2026 | vs Sep 2026 | vs Oct 2025 |
|---|---|---|---|
| Median sale price | $655,000 | +6.5% | +12.3% |
| Median price per sq ft | $225 | +0.2% | -2.6% |
| Pending sales | 89 | -3.3% | -27.6% |
| Months of inventory* | 5.3 | +1.3 | +2.1 |
| Active listings* | 480 | +6.4% | +29.7% |
| Closed sales* | 90 | -21.1% | -22.4% |
| Avg days on market | 32 | +1 day | -3 days |
| Sold at or above list | 15.6% | -7.2 pts | -10.3 pts |
| Median sale-to-list | 97.0% | -0.1 pts | -0.8 pts |
*Preliminary as of 11/5/2026.
The Median Trap
A 12% jump in the median sounds like prices are surging. They aren’t. Price per square foot is down 2.6% from last October and basically flat over the last three months (-0.7%). The median home sold in October was nearly 3,000 square feet, versus about 2,770 a year ago. Bigger homes sold, so the median rose. Price per square foot is the better gauge of value, and it says Woodlands values are steady.
Contracts Just Hit Winter Levels
Pending sales are the best preview of upcoming closings. In October, 89 Woodlands homes went under contract, compared with 123 a year ago and 88 in January. In the $400K to $750K range, the core of the market, contracts fell 25%. Expect a slow November and December for closings.
Buyers Are Negotiating
Only 15.6% of Woodlands homes sold at or above list price in October, down from about 26% a year ago, and just 19% sold within a week. Homes priced right from day one sold in about 23 days for 97% of their original price. Homes that needed a price cut took 48 days and sold for about 92%.
Magnolia Housing Market: October 2026
| Metric | Oct 2026 | vs Sep 2026 | vs Oct 2025 |
|---|---|---|---|
| Median sale price | $369,945 | +12.1% | +4.2% |
| Median price per sq ft | $160 | +0.4% | -4.2% |
| Pending sales | 170 | -6.6% | -13.7% |
| Months of inventory (est.)* | 8.6 | +2.1 | +4.2 |
| Active listings* | 1,358 | +8.4% | +34.5% |
| Closed sales* | 158 | -17.7% | -32.2% |
| Avg days on market | 73 | +10 days | +10 days |
| Sold homes with a price cut | 60.8% | +0.9 pts | +17.9 pts |
| Median sale-to-original list | 93.6% | -1.3 pts | +0.2 pts |
*Preliminary as of 11/5/2026. Builder closings often post late, so October’s sales count will likely rise.
Magnolia Values Are Slipping
Magnolia’s price per square foot fell 4.2% year over year in October, and 2.8% over the last three months. The decline shows up in both new construction (down 2.7% to $155 per square foot) and resale homes (down 3.8% to $182). It’s the first sustained dip in Magnolia values in this data.
The Overpricing Penalty
Magnolia homes priced right from day one sold in about 32 days for 97.6% of their original asking price. Homes that needed a cut took 99 days and sold for about 90%. In Magnolia/1488 West, 70% of sales needed a price cut, and homes averaged 161 cumulative days on market.
Neighborhood Spotlight: Kresston
Kresston is a Magnolia master-planned community in Montgomery County, zoned to Magnolia ISD, and every sale there over the past year was new construction. Over the last 12 months, 114 homes sold at a median of $432,758, but they closed at about 90.6% of their original list price. That’s roughly 9% off the original sticker, and 3 in 4 had a price cut.
This fall, Kresston homes averaged more than 240 cumulative days on market, versus about 64 a year earlier. Some of that can include build time, but finished homes are clearly sitting longer. If you’re buying new in Kresston, there’s real room to negotiate on price, rate buydowns, and closing costs. If you own a resale nearby, price against today’s builder deals, not last year’s sticker prices.
What This Means for Buyers and Sellers
If You’re Selling
- Price it right on day one. In both markets, homes that needed a cut sat twice as long or more and netted 5 to 7 points less.
- Plan for a slow winter. Contracts are already at January levels in The Woodlands.
- In Magnolia, price against the builders. 7 in 10 new homes sold after a price cut.
If You’re Buying
- You have negotiating power. Only 1 in 6 Woodlands homes sold at or above list in October.
- Ask builders for concessions. Kresston and Magnolia West have the most room.
- Use the holiday window. Competition is at its lowest, but well-priced homes still move.
Frequently Asked Questions
Are home prices dropping in The Woodlands?
Not meaningfully. The October 2026 median rose 12% year over year because larger homes sold, while price per square foot fell 2.6% and was roughly flat over three months. Values are steady, but buyers are negotiating harder.
Are home prices dropping in Magnolia TX?
Slightly. Magnolia’s price per square foot fell 4.2% year over year in October 2026 and 2.8% over the last three months, with declines in both new construction and resale homes.
Is it a good time to buy a home in The Woodlands or Magnolia?
Buyers have more leverage than they’ve had in years. The Woodlands has about 5.3 months of inventory (balanced), and Magnolia has about 8.6 months (a buyer’s market). Price cuts and builder concessions are common.
Want Your Home’s Real Number in This Market?
Grab the full October report, or call or text me at (346) 202-4020 for a pricing strategy built on current MLS data.
Download the Free Report
Source: HAR MLS, single-family homes, October 2026 (preliminary as of 11/5/2026). The Woodlands = HAR Geo Market Area “The Woodlands.” Magnolia = “Magnolia/1488 East” and “Magnolia/1488 West” combined. September figures restated with final MLS data. Data deemed reliable but not guaranteed.
Mike Krynski, REALTOR® | Keller Williams The Woodlands & Magnolia | TREC License #0835936
TREC Information About Brokerage Services | Consumer Protection Notice